Understanding Linear Inequalities in Algebra
Linear inequalities are fundamental in Algebra 1 and involve expressions where the sides of the inequality are connected by symbols such as >, < , \geq, or \leq. These inequalities represent half-planes in a coordinate system, and their solutions usually involve graphing to visualize the range of possible solutions.
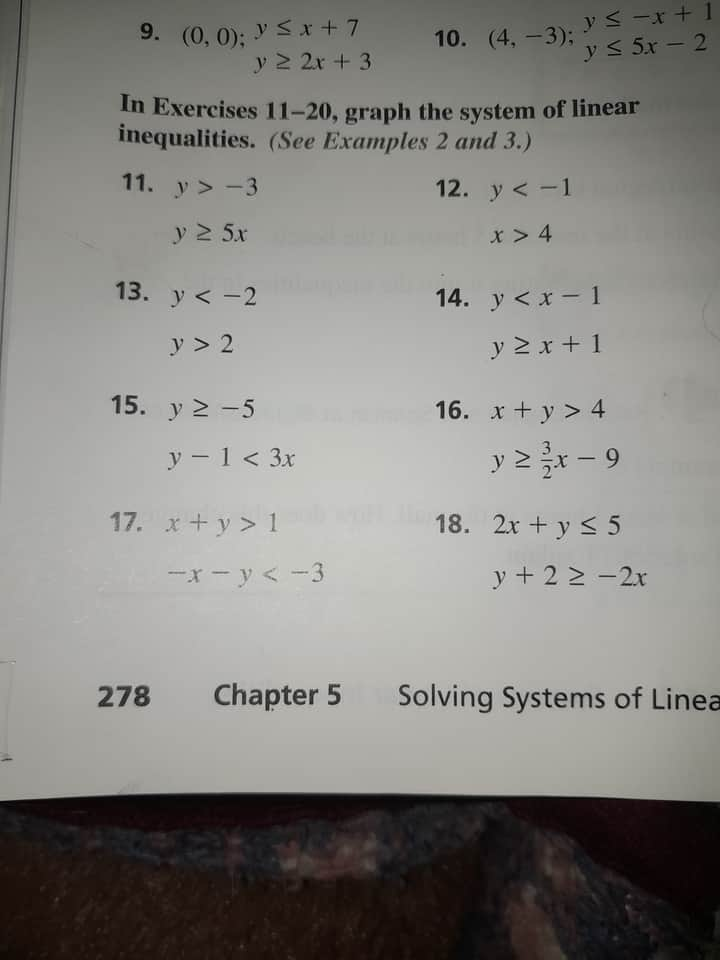
In the image provided, you’re tasked with graphing systems of linear inequalities. Let’s go through the steps for some examples to develop a comprehensive understanding of how to handle this task.
Example Problem: Graphing the System of Linear Inequalities
Let’s consider example 11 from the image:
Problem 11:
- ( y > -3 )
- y \geq 5x
To graph these inequalities:
Step 1: Graph the Line for ( y = -3 )
- Equation: ( y = -3 ) is a horizontal line.
- Graph: Draw a dashed line because the inequality (>) does not include the line itself.
- Shade Upward: Shade the area above the line since (y) is greater than (-3).
Step 2: Graph the Line for ( y = 5x )
- Equation: ( y = 5x ) is a line with a slope of 5 passing through the origin (0,0).
- Graph: Draw a solid line because the inequality \geq includes the line itself.
- Shade Upward/Right: Shade the area above the line since (y) is greater than or equal to (5x).
Solution Region
- The solution to the system of inequalities is the region where the shaded areas overlap. This region represents all the points ((x, y)) satisfying both inequalities simultaneously.
Interpreting the System of Inequalities
Using systems such as these, graphing becomes a tool to find simultaneously valid solutions that fit all inequality conditions. Let’s try another example from the provided list:
Example Problem: Graphing the System for 14
Problem 14:
- y < x - 1
- y \geq x + 1
Step 1: Graph the Line for ( y = x - 1 )
- Equation: ( y = x - 1 ) has a slope of 1, crossing the y-axis at (-1).
- Graph: Since it is < draw a dashed line.
- Shade Down/Left: The shading goes below the line as (y) is less than x - 1.
Step 2: Graph the Line for ( y = x + 1 )
- Equation: y = x + 1 with a slope of 1 crossing the y-axis at (1).
- Graph: Draw a solid line because of \geq.
- Shade Up/Right: Shade above the line indicating all solutions where (y) is greater than or equal to x + 1
Solution Region
- In this particular system, you may notice there is no overlapping region. This indicates there are no solutions that satisfy both inequalities simultaneously. On a graph, these would appear as non-overlapping dashed/solid areas.
More Examples: Continuing Practice
To perfect your graphing skills, attempt the other exercises (15-18) using these guidelines, graphing each line, and determining the shaded areas correctly based on the inequality types.
Tips for Success
- Draw Accurately: Use a ruler for precise line graphs.
- Shade Clearly: Use different colors or patterns to represent different inequalities.
- Check Solutions: Verify potential solution points by substituting back into original inequalities for accuracy.
By mastering these practices in Algebra 1, graphing linear inequalities becomes an intuitive visual process, showing the myriad of solutions constraints interact with in what’s often a two-dimensional space. This foundation prepares you for exploring more complex systems in Algebra 2 and higher mathematics. @username