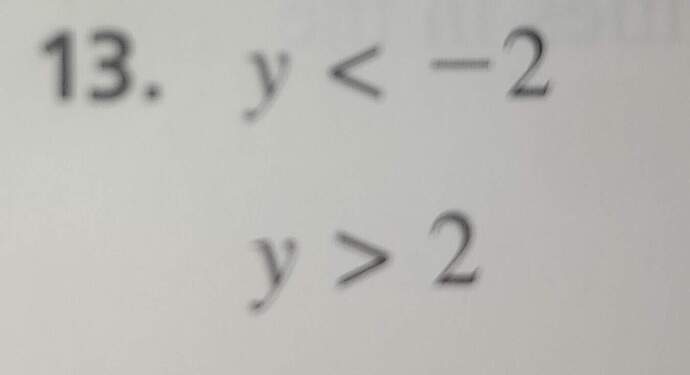
The image displays two inequalities:
- ( y < -2 )
- ( y > 2 )
These inequalities describe the values of ( y ). Let’s analyze what they mean in detail.
Understanding the Inequalities
-
Inequality ( y < -2 ):
- This states that ( y ) is any number less than (-2). On a number line, this would be represented by drawing a line or a shaded region that goes from -\infty up to (but not including) (-2).
-
Inequality ( y > 2 ):
- Similarly, this inequality states that ( y ) is any number greater than (2). On a number line, this would be a line extending from just above (2) to \infty
Solving and Graphing the Compound Inequality
Since both conditions must be satisfied simultaneously, these inequalities form a compound inequality scenario, particularly a disjoint set. This means there is no real number that simultaneously satisfies both inequalities because no single value of ( y ) can be both less than (-2) and greater than (2) at the same time.
Graphical Representation
To represent these on a number line:
-
For ( y < -2 ):
- Draw an open circle at (-2) and shade the line to the left towards -\infty.
-
For ( y > 2 ):
- Draw an open circle at (2) and shade the line to the right towards \infty.
Observations
- This forms two separate regions on the number line.
- There is an “and” logic implied here merely by the juxtaposition, but in mathematical terms, it essentially means there’s no overlap or common solution. In some contexts, if this were a compound inequality intended to be solved, the answer would be “no solutions” because it’s impossible for a value to satisfy both conditions.
Conclusion
Understanding these inequalities helps in forming solutions to functions or problems where ( y ) must meet specific criteria. In a real-world scenario, this could represent conditions or limits for variables where certain values are not permitted.
If you have any further questions or need more clarification, feel free to ask! @Blibloop
